Analyzing Thursday's trades:
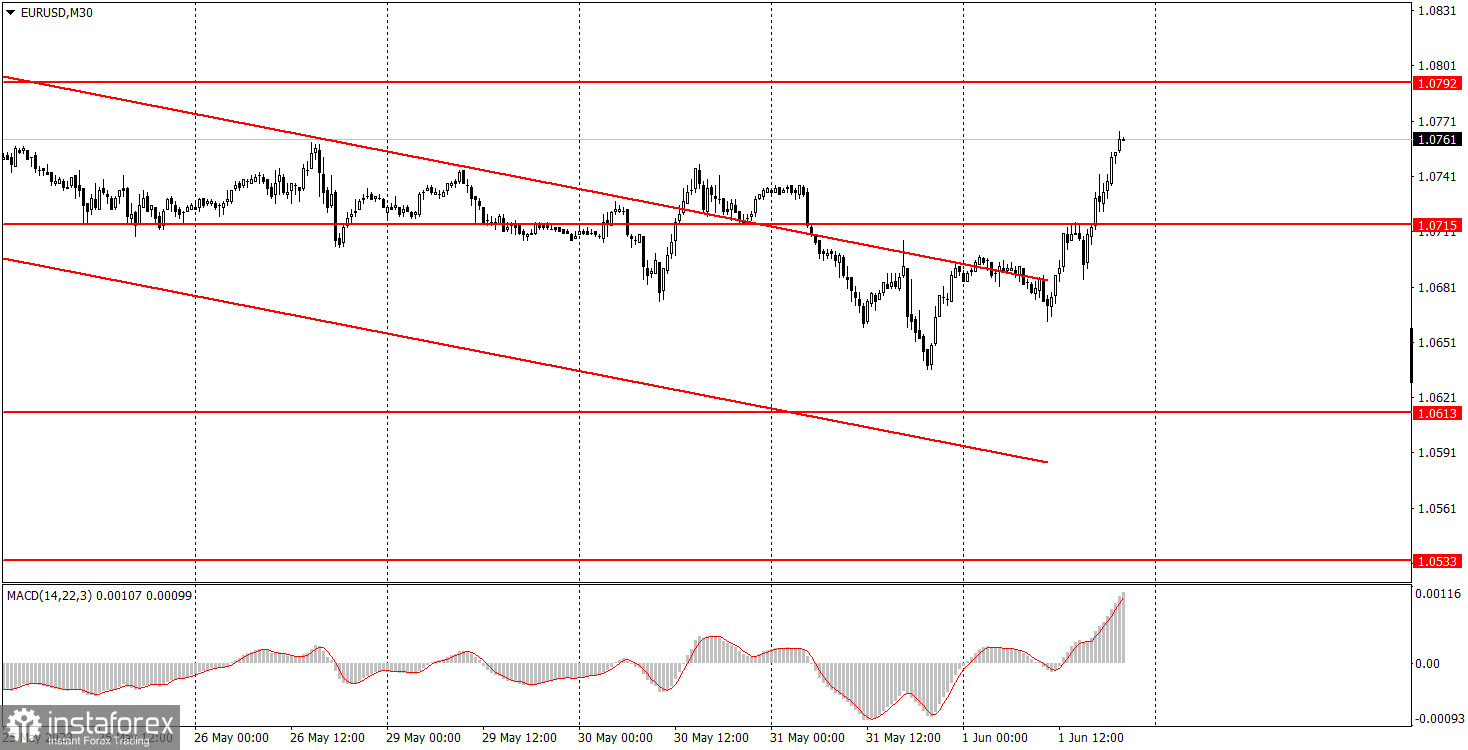
EUR/USD on 30M chart
The EUR/USD pair started a new phase of upward movement on Thursday, confirming its intention to end the downtrend that lasted for about a month. Therefore, in the near future, the pair could rise based on technical factors. The fundamental and macroeconomic background on Thursday was strong. Firstly, the euro area released its inflation report for May, which turned out to be lower than already optimistic forecasts. Secondly, European Central Bank President Christine Lagarde's speech confirmed the need to continue raising interest rates as inflation still remains at unsatisfactory levels. Therefore, the euro had a logical reason to rise. The inflation report could have triggered a new decline in the euro, but this currency has been falling for about a month, and it seems that it's time for a correction. In addition, there is almost no correlation between inflation and interest rates anymore. The US data had virtually no impact on the movement of the pair, although it could have supported the dollar.
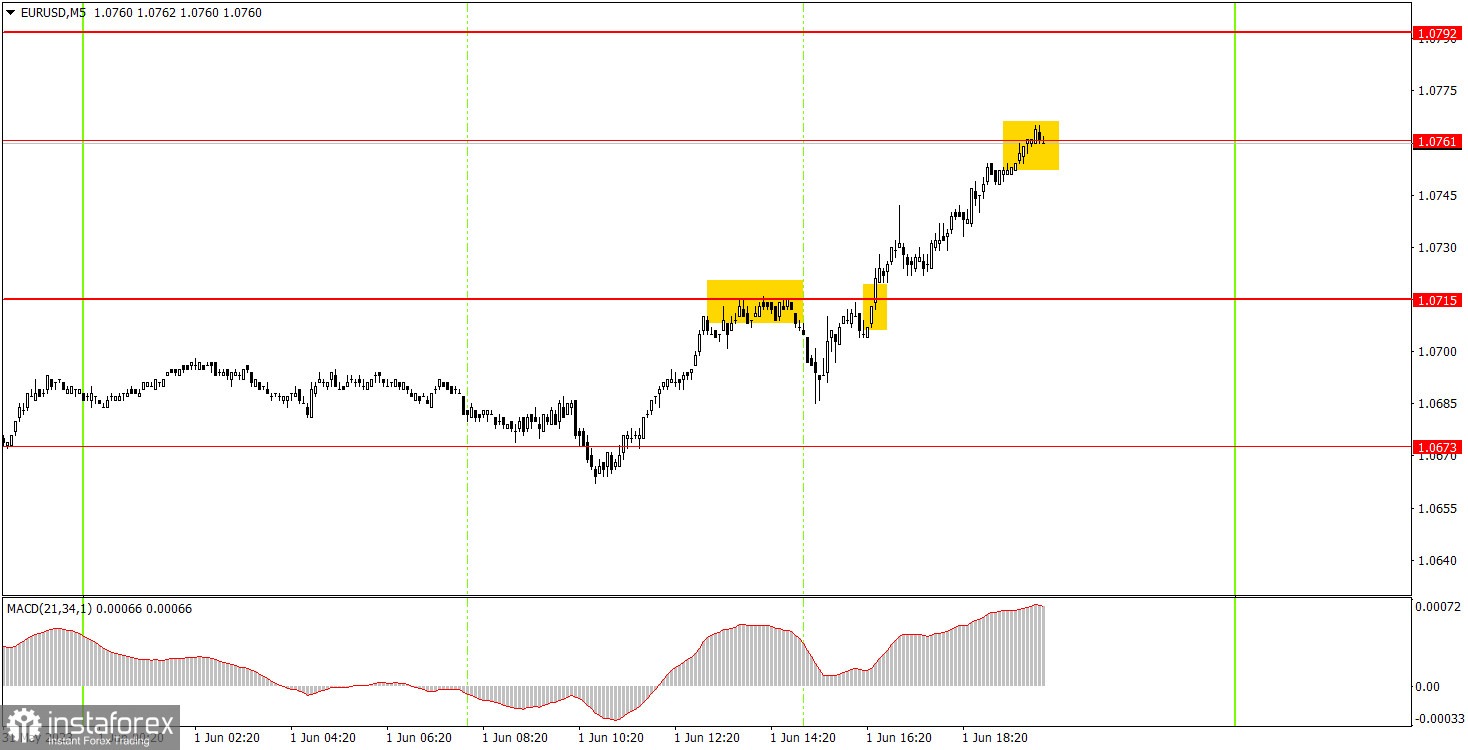
EUR/USD on 5M chart
There were two trading signals on the 5-minute chart. First, the pair bounced off the level of 1.0715 and managed to move down by about 20 pips, which was only enough to set the stop loss at breakeven. Then it consolidated above the level of 1.0715, afterwards the pair moved up by 35 pips, which could have been profitable for beginners as this trade should have been closed around the target level of 1.0761, which was hit. The level of 1.0673 has been restored. However, I still believe that the current movement is not favorable. The fundamental background strongly influenced the pair's movement. If it weren't for that, there might not have been a downward retracement at the beginning of the US trading session.
Trading tips on Friday:
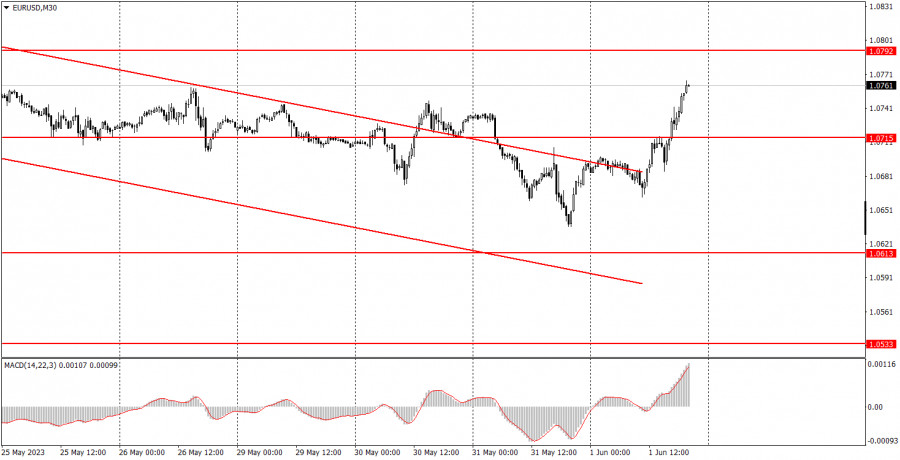
As seen on the 30M chart, the pair is willing to end the downtrend. The price has left the descending channel, and this was confirmed on Thursday. Therefore, the euro may rise for a while, but in the medium-term perspective, we still expect a decline from it. The key levels on the 5M chart are 1.0517-1.0533, 1.0607-1.0613, 1.0673, 1.0715, 1.0761, 1.0792, 1.0857-1.0867. A stop loss can be set at a breakeven point as soon as the price moves 15 pips in the right direction. On Friday, there are no important events planned in the European Union, but in the US, the non-farm payrolls and unemployment reports, which are undoubtedly key reports of the week, will be published. We believe that the market reaction to this data can be very strong, and the dollar may even appreciate again, but the trend has already changed to upward, so next week the pair could rise further. And it can also rise on Friday if the US data turns out to be weak.
Basic rules of the trading system:
1) The strength of the signal depends on the time period during which the signal was formed (a rebound or a break). The shorter this period, the stronger the signal.
2) If two or more trades were opened at some level following false signals, i.e. those signals that did not lead the price to Take Profit level or the nearest target levels, then any consequent signals near this level should be ignored.
3) During the flat trend, any currency pair may form a lot of false signals or do not produce any signals at all. In any case, the flat trend is not the best condition for trading.
4) Trades are opened in the time period between the beginning of the European session and until the middle of the American one when all deals should be closed manually.
5) We can pay attention to the MACD signals in the 30M time frame only if there is good volatility and a definite trend confirmed by a trend line or a trend channel.
6) If two key levels are too close to each other (about 5-15 pips), then this is a support or resistance area.
How to read charts:
Support and Resistance price levels can serve as targets when buying or selling. You can place Take Profit levels near them.
Red lines are channels or trend lines that display the current trend and show which direction is better to trade.
MACD indicator (14,22,3) is a histogram and a signal line showing when it is better to enter the market when they cross. This indicator is better to be used in combination with trend channels or trend lines.
Important speeches and reports that are always reflected in the economic calendars can greatly influence the movement of a currency pair. Therefore, during such events, it is recommended to trade as carefully as possible or exit the market in order to avoid a sharp price reversal against the previous movement.
Beginners should remember that every trade cannot be profitable. The development of a reliable strategy and money management are the key to success in trading over a long period of time.