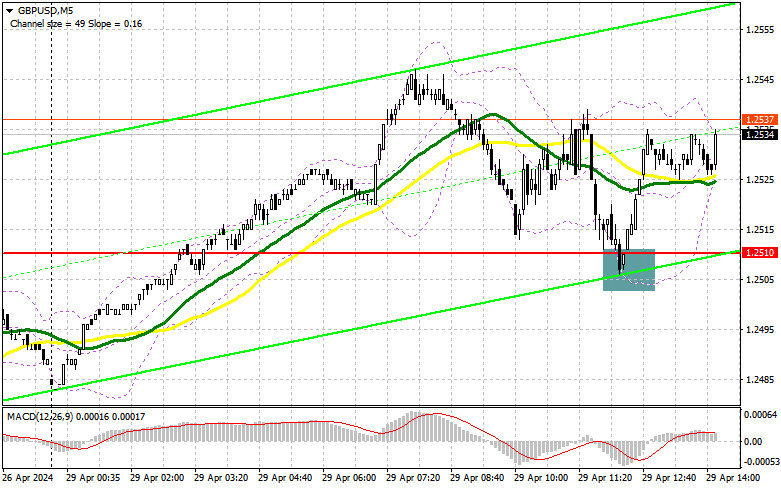
In my morning forecast, I paid attention to the 1.2510 level and planned to make decisions on entering the market from it. Let's look at the 5-minute chart and figure out what happened there. The decline and the formation of a false breakdown there after an unsuccessful attempt to gain a foothold below 1.2510 allowed us to get a buy signal, which resulted in a 30-point increase in the pair. In the afternoon, the technical picture was not revised.
To open long positions on GBP/USD, you need:
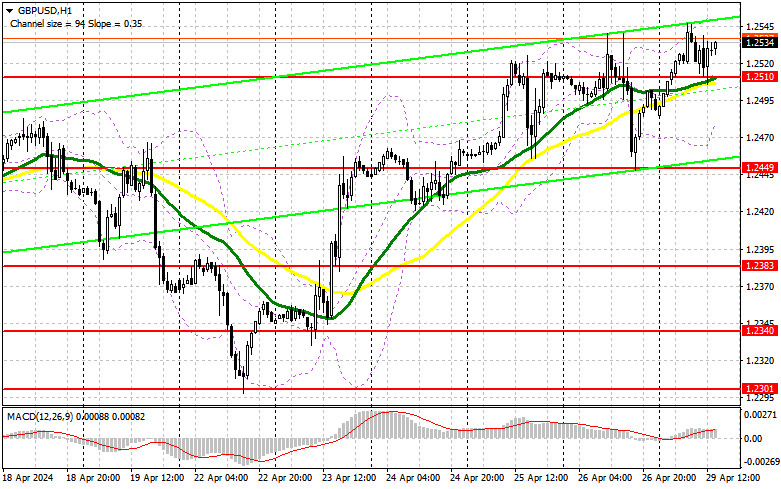
The lack of statistics for the UK helped the buyers of the pound to beat off 1.2510 and now let's see if they will be able to achieve an update to the weekly maximum or not. The reason for the low volatility in the afternoon will be the complete absence of any data on the United States and the impending meeting of the Federal Reserve System, which will be able to change the current "rules of the game". For this reason, it is not necessary to force events: the formation of a false breakdown in the support area of 1.2510, by analogy with the first half of the day, will give an entry point to buy in order to grow to the resistance of 1.2573. The moving averages also pass around 1.2510, so you can again count on the active actions of the bulls. A breakout and a top-down test of 1.2573 will give a chance for GBP/USD growth, which will allow you to reach 1.2621. In the case of an exit above this range, we can talk about a breakthrough to 1.2658, where I'm going to fix profits. A test of this level is unlikely today, but anything is possible in the market. In the scenario of a fall in GBP/USD and the absence of buyers at 1.2510 in the afternoon, the market will maintain balance, and trading will move within the framework of the side channel. In this case, I will look for purchases in the area of 1.2449. The formation of a false breakdown there will be a suitable option for entering the market. It is possible to open long positions on GBP/USD immediately on a rebound from 1.2383 in order to correct 30-35 points within a day.
To open short positions on GBP/USD, you need:
The bears still have a chance to continue to return to the pair's decline, but for this they need to take 1.2510, which they failed to do in the first half of the day. In case of further growth of the pair, I will postpone sales until the test of the new resistance of 1.2573, which buyers have been looking at with great interest for a long time. Only the formation of a false breakdown there will make sure that large sellers are present in the market, which will lead to a fall in GBP/USD to the area of 1.2510, where the moving averages are located. A breakout and a reverse test from the bottom up of this range will increase the pressure on the pair, giving the bears an advantage and another entry point to sell with the aim of updating 1.2449. The ultimate target will be the minimum of 1.2383, where I will take a profit. In the scenario of GBP/USD rising and the absence of bears at 1.2573 in the second half of the day, bulls will have the opportunity to continue building an upward trend with movement towards the resistance at 1.2621. I will only enter there on a false breakout. If there is no activity there either, I suggest opening short positions on GBP/USD from 1.2658, expecting a pair to rebound down by 30-35 points within the day.

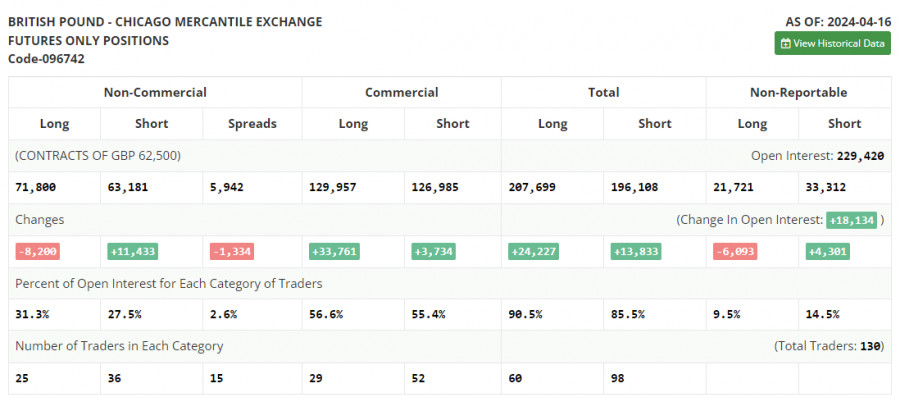
In the COT report (Commitment of Traders) as of April 16th, there was a sharp decrease in long positions and an increase in short positions. Pound buyers continue to exit the market, and there are objective reasons for this: recent inflation data in the UK and the US indicated the need for further efforts to combat rising prices, which will surely prompt central banks to continue with a tough stance. Considering that the UK economy is suffering much more from all this than the US economy, it is not surprising why pressure on the British pound has sharply increased. New statements from regulator representatives also negatively affected the bullish prospects for the pound. Adding to all this, the need to maintain a tough stance by the Federal Reserve makes it unlikely that we can expect a strong bullish market in the GBP/USD pair. The latest COT report states that long non-commercial positions decreased by 8,200 to 71,800, while short non-commercial positions increased by 11,433 to 63,181. As a result, the spread between long and short positions decreased by 1,334.

Indicator signals:
Moving averages
Trading is conducted above the 30 and 50-day moving averages, indicating a bullish market.
Note: The period and prices of moving averages considered by the author are on the hourly chart H1 and differ from the general definition of classical daily moving averages on the daily chart D1.
Bollinger Bands
In the event of a decline, the lower boundary of the indicator, around 1.2475, will act as support.
Description of indicators
- Moving average (determines the current trend by smoothing volatility and noise). Period 50. Marked in yellow on the chart.
- Moving average (determines the current trend by smoothing volatility and noise). Period 30. Marked in green on the chart.
- MACD indicator (Moving Average Convergence/Divergence). Fast EMA period 12. Slow EMA period 26. SMA period 9.
- Bollinger Bands. Period 20.
- Non-commercial traders - speculators such as individual traders, hedge funds, and large institutions using the futures market for speculative purposes and meeting certain requirements.
- Long non-commercial positions represent the total long open position of non-commercial traders.
- Short non-commercial positions represent the total short open positions of non-commercial traders.
- The total non-commercial net position is the difference between non-commercial traders' short and long positions.


