
empty
 
 
22.01.2024 09:04 AM
Hot forecast for GBP/USD on January 22, 2024

The UK retail sales data turned out to be quite alarming that the pound immediately started to fall after this report. This is not surprising, as instead of accelerating from 0.2% to 1.5%, retail sales fell to -2.4%. However, a few hours after the opening of the U.S. trading session, not only did the pound pare its losses but it also managed to completely recover. The British currency suddenly received support. Usually, data on existing home sales in the United States does not have a significant impact on the market. The only exception is when the data shows a sharp change compared to the previous period. And this is exactly what happened. Sales were expected to rise by 0.3%, but they actually plummeted to -1.0%. So not only did they not grow, but the decline was also quite significant. Today, the market is likely to consolidate around current levels. The reason behind this is the empty economic calendar for Monday. And perhaps this is for the better because the European Central Bank's meeting is scheduled for Thursday. So the market has some time to reflect and prepare for this significant event. If there are no unexpected and major news developments, the market will likely remain stagnant.

This image is no longer relevant

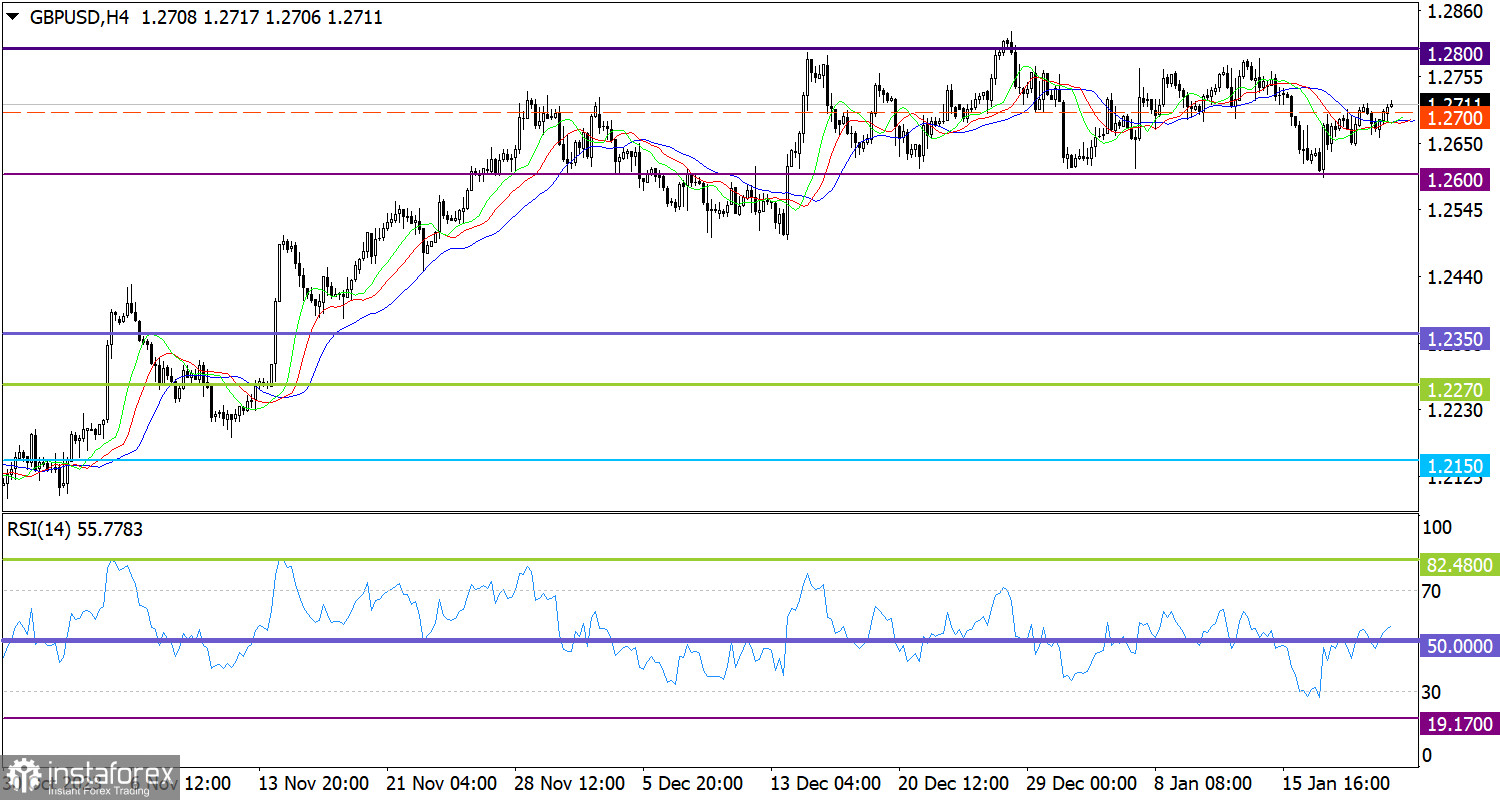
GBP/USD is moving within a five-week sideways channel between 1.2600 and 1.2800, consistently testing these boundaries. Currently, the price is stable above the middle level of 1.2700, indicating an increase in long positions within the range.

On the 4-hour chart, we observed a similar cycle of movement from the RSI indicator, corresponding to price fluctuations within the sideways channel. Initially, the indicator nearly reached a low RSI level below 30, which indicates an oversold condition. Afterwards, a rebound followed. Currently, the indicator is moving above 50, indicating an increase in long positions.

Meanwhile, the Alligator's MAs are intertwined in the 4-hour chart. However, this consolidation only reflects a change in the cycle within the channel.

Outlook

In this situation, you may consider trading within the boundaries of the sideways channel, as the price could move towards the upper boundary of the channel at 1.2800.

However, it is important to remember that a sideways channel represents a temporary price pattern that leads to significant attention from speculators. Eventually, there will be impulsive moves that will signal the end of the channel and indicate the subsequent market direction. For this reason, it's advisable to consider breakout strategies.

Complex indicator analysis suggests a bullish bias within the channel's structure in the short-term and intraday periods.

Dean Leo,
انسٹافاریکس کا تجزیاتی ماہر
© 2007-2026
Summary
Urgency
Analytic
Dean Leo
Start trade
انسٹافاریکس کے ساتھ کرپٹو کرنسی کی معاملاتی تبدیلیوں سے کمائیں۔
میٹا ٹریڈر 4 ڈاؤن لوڈ کریں اور اپنی پہلی ٹریڈ کھولیں۔
  • Grand Choice
    Contest by
    InstaForex
    InstaForex always strives to help you
    fulfill your biggest dreams.
    مقابلہ میں شامل ہوں
  • چانسی ڈیپازٹ
    اپنے اکاؤنٹ میں 3000 ڈالر جمع کروائیں اور حاصل کریں$1000 مزید!
    ہم اگست قرعہ اندازی کرتے ہیں $1000چانسی ڈیپازٹ نامی مقابلہ کے تحت
    اپنے اکاؤنٹ میں 3000 ڈالر جمع کروانے پر موقع حاصل کریں - اس شرط پر پورا اُترتے ہوئے اس مقابلہ میں شرکت کریں
    مقابلہ میں شامل ہوں
  • ٹریڈ وائز، ون ڈیوائس
    کم از کم 500 ڈالر کے ساتھ اپنے اکاؤنٹ کو ٹاپ اپ کریں، مقابلے کے لیے سائن اپ کریں، اور موبائل ڈیوائسز جیتنے کا موقع حاصل کریں۔
    مقابلہ میں شامل ہوں
  • 30 فیصد بونس
    ہر بار جب آپ اپنا اکاؤنٹ ٹاپ اپ کریں تو 30 فیصد بونس حاصل کریں
    بونس حاصل کریں

تجویز کردہ مضامین

ابھی فوری بات نہیں کرسکتے ؟
اپنا سوال پوچھیں بذریعہ چیٹ.
Widget callback